The Bill Lane Center for the American West, Stanford University
![]()
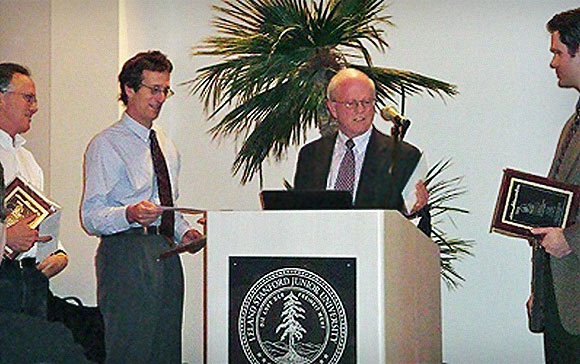
James V. Risser, emeritus director of the John S. Knight Journalism Fellowships, gives the 2009 Risser Prize winners their awards. From left to right, they are Steve Ringman, Hal Bernton and Justin Mayo.
January 2010 Symposium: “Visualizing the Environment”
John S. Knight Fellowships
For Seattle Times journalist Hal Bernton, a picture turned out to be worth more than a thousand words. It kicked off an investigation into the link between logging permit practices and a storm’s extraordinary devastation. And the graphic “visualization” the team went on to produce was worth a million.
The photo was one of a few aerial shots photographer taken by Steve Ringman. It showed the top of a mountain with nearly all its soil swept away, the extreme denuding the result of a monstrous rainstorm in 2007 – and, clear-cutting on the forest top.
That picture launched what would become an investigation into logging permitting procedures in Washington — and the trigger for a sustainable forestry initiative in the state.
With the help of colleague Justin Mayo, a graphic journalist, Bernton and Ringman were able to show in simple visual form the way runaway logging had exacerbated storm damage. The “graphic representation” they produced is a method increasingly being used to create easy-to-grasp pictures of changes over time.
The journalists described their entry into this new way of presenting information at a symposium on the topic at Stanford, where James V. Risser awarded them the $5,000 Prize for Western Environmental Journalism. Risser, a two-time Pulitzer winner in environmental reporting, is the emeritus director of the John S. Knight Journalism Fellowships, which co-sponsors the prize and symposium with the Bill Lane Center for the American West.
The Knight Fellowship is a 44-year-old program in the Communications Department at Stanford University that supports the professional development of working journalists. In response to the changing media field, last year it added an entrepreneurial component to the academic sabbatical.
The Bill Lane Center for the American West is dedicated to advancing scholarly and public understanding of the past, present, and future of western North America. It supports research, teaching, and reporting about western land and life in the United States, Canada, and Mexico. As part of those efforts, it encourages scholars and journalists in the use of graphic data visualizations to stimulate public conversation and better-informed policy decisions on the environment.
Digital mapping tools helped the Times’ team’s reporting dig deeper and added another visual punch to their discoveries. The team was among a number of digital graphics advocates who spoke at the symposium, titled “Visualizing the Environment: Mapping Data and Telling Stories in Journalism, Scholarship and Environmental Policy.”
While landslides are not uncommon in the northwest, where logging is a major industry and rain abundant, the storm that hit the Upper Chehalis River Basin in the winter of 2007 caused 730 landslides, according to the Times story “Logging and Landslides: What Went Wrong?”
The extent of the destruction — homes, water systems and herds of cattle drowned in mud; farms and fields covered with debris and timber — troubled Bernton.
“I wondered if the up-valley drainages that were heavily logged might have a lot of landslides that contributed a lot of the soil and wood,” he said.
The only way to know was to go look. With the roads in the mountain drainages shut down and bridges washed or blown out — his only hope was to get up in a plane. Ringman had brought back one picture linking clear-cutting and storm damage. They needed to see if there were more. Yet the images the paper already had were so spectacular, it took some nudging to get it to pay for another helicopter trip. But Bernton convinced photographer Steve Ringman, who persuaded his boss.
Ringman brought back ever-more-stunning images. One became iconic for their findings — they’d later call it “Steve Mountain.” The new flyover pictures showed the sheer extent of the slides and their proliferation in clear-cut areas. Their investigation had begun.
Mayo, a graphic artist, described getting digitized data on clear-cut sites from the Department of Natural Resources, and overlaying it on their aerial photos. Each step prompted more reporting, and the discovery of more data maps with additional information, such as slope steepness and high-risk zones. The result was an interactive map that illustrated the link between logging permitting and the storm’s impact.
The series models the kind of journalism honored by the Risser Prize, envisioned as a Pulitzer of environmental reporting, said Jon Christensen, executive director of the Bill Lane Center for the American West. These projects feature “data presented in ways that allow the public and policy makers to visualize environmental changes so we can act.”
Graphical representation aids reporting in showing how changes have “reduced the resiliency of the landscape, particularly as we anticipate more extreme events, like global warming, but also things like logging that reduce the ability of the land to adapt,” said Robin Grossinger, a scientist at the San Francisco Estuary Institute. He has employed geo-mapping to show the historical evolution of landscapes, such as the density of oak trees in southern Silicon Valley.
Grossinger, also on the panel discussion on data mapping, was involved in a 2002 project called BayBoards, something of a precursor to computer visualization in which “reclaimed views” of local settings were put up on billboards around the Bay Area. The images were created using the tools of art and science, including computer-based mapping, hand drawings, inter-calibration of sources, and contemporary photography.
“This is where data visualization is going,” said panelist Jeff Heer, assistant professor at Stanford’s Human-Computer Interaction and Visualization Lab. “It gives you the ability to go behind data to see patterns.
“Visualization is an answer to a question,” he said. “By choosing which data to show, you’re already formulating a hypothesis of what’s important to ask. But it can also help determine ‘what questions should I be asking’?”
Digital mapping tools helped the Times’ team’s reporting dig deeper and added another visual punch to their discoveries. The team was among a number of digital graphics advocates who spoke at the symposium, titled “Visualizing the Environment: Mapping Data and Telling Stories in Journalism, Scholarship and Environmental Policy.”
Texas Tribune, ProPublica

The Desert Sun and USA Today
CPI, InsideClimate News, The Weather Channel
The Seattle Times
The Sacramento Bee
High Country News
5280 Magazine
Seattle Post-Intelligencer
What Went Wrong?
The Seattle Times
San Antonio Express-News
The Los Angeles Times
High Country News

For more information: knightrisserprize@lists.stanford.edu